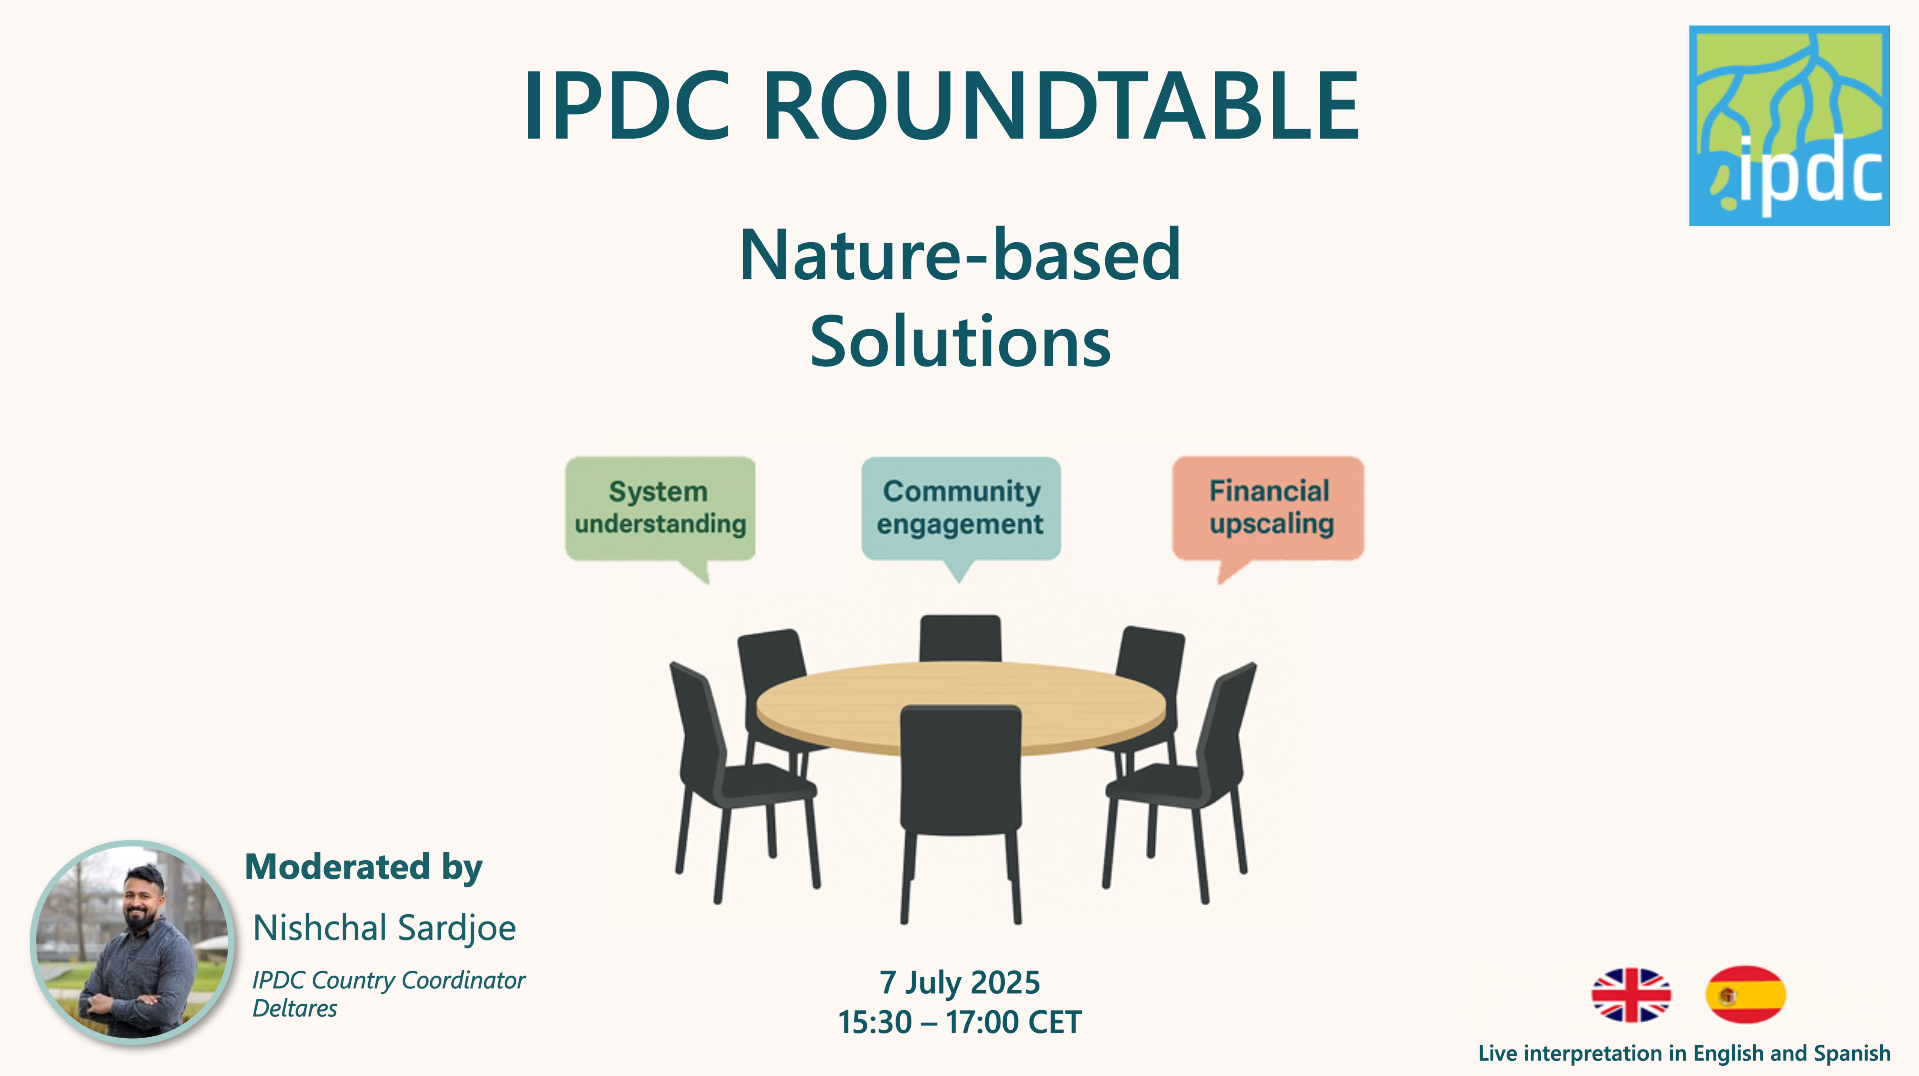
What experiences and inspiration can be drawn from the Dutch Caribbean’s use of Climate Atlases? A recent online session, presented by Climate Adaptation Services (CAS) and Nelen & Schuurmans, explored how Climate Impact Atlases are designed and used to visualise climate hotspots, vulnerabilities, and trends. These open-access tools support decision-makers, businesses, and communities in planning for climate resilience.
Climate adaptation in the Dutch Caribbean: a strategic framework
The IPDC plays an important role in accelerating climate adaptation across the six Dutch Caribbean islands. The approach follows a clear and effective framework: Analysis → Ambition → Action.
- Analysis: The foundation was laid with the development of Climate Impact Atlases for each island.
- Ambition: Each island is crafting its own adaptation strategy, reflecting local priorities and visions. The IPDC supports this process through overarching and island-specific projects.
- Action: Implementation of the climate adaptation strategies.
Drawing on Dutch expertise is crucial particularly the Climate Impact Atlas. This has been tool refined for over 15 years in the Netherlands, and is now being adapted to the Caribbean context. This collaborative effort involves NGOs, research institutions, businesses, and governments. Partners like Nelen & Schuurmans play a vital role by contributing their data and mapping expertise.
Inside the Climate Impact Atlas: tools for local action
The session included a hands-on demonstration of the Climate Impact Atlases, which are digital, open-access tools designed to support evidence-based decision-making at the local level. Each atlas is tailored to the specific context of its island, developed in close collaboration with local stakeholders. Each Atlas is made up of six core components:
- An interactive map viewer, which displays a range of maps showing climate risks, hotspots, and vulnerabilities
- Map explanations, which provide background information and suggest potential adaptation measures.
- A climate impact tool, which illustrates how various climate impacts are interconnected, based on insights from local workshops.
- A climate statistics tool that projects future climate trends using downscaled data.
- Climate stories; these are fictional narratives written by local authors to make climate change more relatable and tangible.
- A knowledge portal, which offers resources and guidance on adaptation strategies and best practices.
These atlases empower decision-makers, businesses, and communities by providing accessible data and fostering regional knowledge sharing. The inclusion of local expertise ensures that each atlas is not only scientifically robust but also culturally and contextually relevant.
Behind the maps: flood modelling in data-scarce environments
The session also included a behind the scenes look at the flood mapping process used in the Climate Impact Atlases. Using the Dutch Caribbean islands as a case study, participants learned how flood maps are created for data-scarce environments. This method can be applied globally. The process consists of several steps:
- Data collection: gathering local data on buildings, infrastructure, rainfall patterns, soil types, and elevation.
- Modelling: combining local insights with open-source satellite data to build hydrological models. These models simulate water flow, depth, and direction during flood events.
- Validation: validating maps through on-the-ground sessions with local residents, who confirm whether the maps reflect real flood experiences.
- Application: the resulting maps help municipalities and governments make informed decisions about where to build—or avoid building—critical infrastructure.
Flood maps have been developed for all six islands: Aruba, Bonaire, Curaçao, Saba, St. Eustatius (Statia), and St. Maarten. These tools are already proving valuable for spatial planning and climate resilience.
Interactive discussion
The session also included an interactive discussion, offering participants a deep dive into the technical, practical, and community-driven aspects of the Climate Impact Atlas and related modelling work across the Caribbean islands. Key points raised during the discussion included:
Sharper elevation models, smarter solutions
New digital elevation models (DEMs) are transforming flood mapping by revealing the fine details that matter for solutions. Instead of seeing a vague “blob” of flooding, improved DEMs expose small rivers and flow paths. This makes it easier to identify where interventions like levees or barriers could prevent inundation. This shift moves the conversation from simply understanding risk to actively designing strategies for resilience.
Speed and scale in modelling
Once models are set up, generating static flood maps is fast; this can be a matter of days. Simulating new events takes only a few hours, even at high resolution. Current models run at 50-centimetre resolution, with work underway on 10-centimetre grids. Interestingly, computation time depends more on cell size than DEM resolution. For rapid applications like early warning systems, models can run in minutes, while detailed analyses take longer but remain efficient. The trade-off between speed and precision depends on the intended use.
Data that drives decision-making
Flood models rely on forcing data, such as spatially distributed rainfall, sourced from local meteorological institutes when possible. Satellite data can be used where gaps exist. Validation, however, remains a challenge. Community feedback is invaluable but subjective; actual measurements – water levels, photos, and sensor data – are critical for accuracy. Elevation models are improving, but more calibrated, context-specific data is needed. Building a network of water level stations and expanding regional collaboration could significantly enhance reliability.
Maps that empower
The Climate Impact Atlas began as a paper-based tool in the Netherlands 15 years ago, and now serves as a digital platform for visualising climate risks. Its strength lies in making complex data accessible. This empowers policy-makers, planners, and even citizens to visualise how climate change might affect their communities. Features such as the scenario buttons for 2050 and 2100 allow users to compare current conditions with future projections. An example of this is the rise in hot nights or sea-level trends. Although not a real-time predictive system, the Atlases provide essential insights for long-term planning.
Stories connecting science and society
Not everyone interprets maps easily, which is why storytelling has become a powerful complement to data visualisation. Climate stories, written by local authors, translate scientific insights into relatable narratives grounded in lived experiences. This approach resonates culturally – especially on islands where oral traditions and imagery carry weight. Suggestions from community workshops have even inspired printed materials for schools, ensuring that climate conversations reach households and spark intergenerational dialogue.
Building knowledge for the future
The Atlases are more than a collection of maps; they set an agenda for data collection and collaboration. Partnerships, like those in St. Maarten, have already unlocked previously inaccessible datasets. The long-term vision is a ‘public knowledge infrastructure’ that is locally owned and managed, supported by capacity building and continuous engagement. Looking ahead five to ten years, success will be measured not just by plans but by action. In other words, real-world changes informed by the Atlases and monitored over time.
Speakers
A huge thank you to our speakers:
- Kim van Nieuwaal, CAS
- Amber van de Kerkhof, CAS
- Sjon van Dijk, Nelen & Schuurmans
- Jim Lilly, Deltares (moderator)
Download the slides
Check out the session’s presentation here.